Spring has officially arrived — and the housing market across Eastern Iowa is responding right on cue. March brought a noticeable jump in activity, especially on the buyer side, with strong increases in pending listings and sales volume across both the Cedar Rapids and Iowa City metro areas. Here’s a closer look at how the market performed.
Cedar Rapids Metro Area
Cedar Rapids, Hiawatha, Marion, Robins
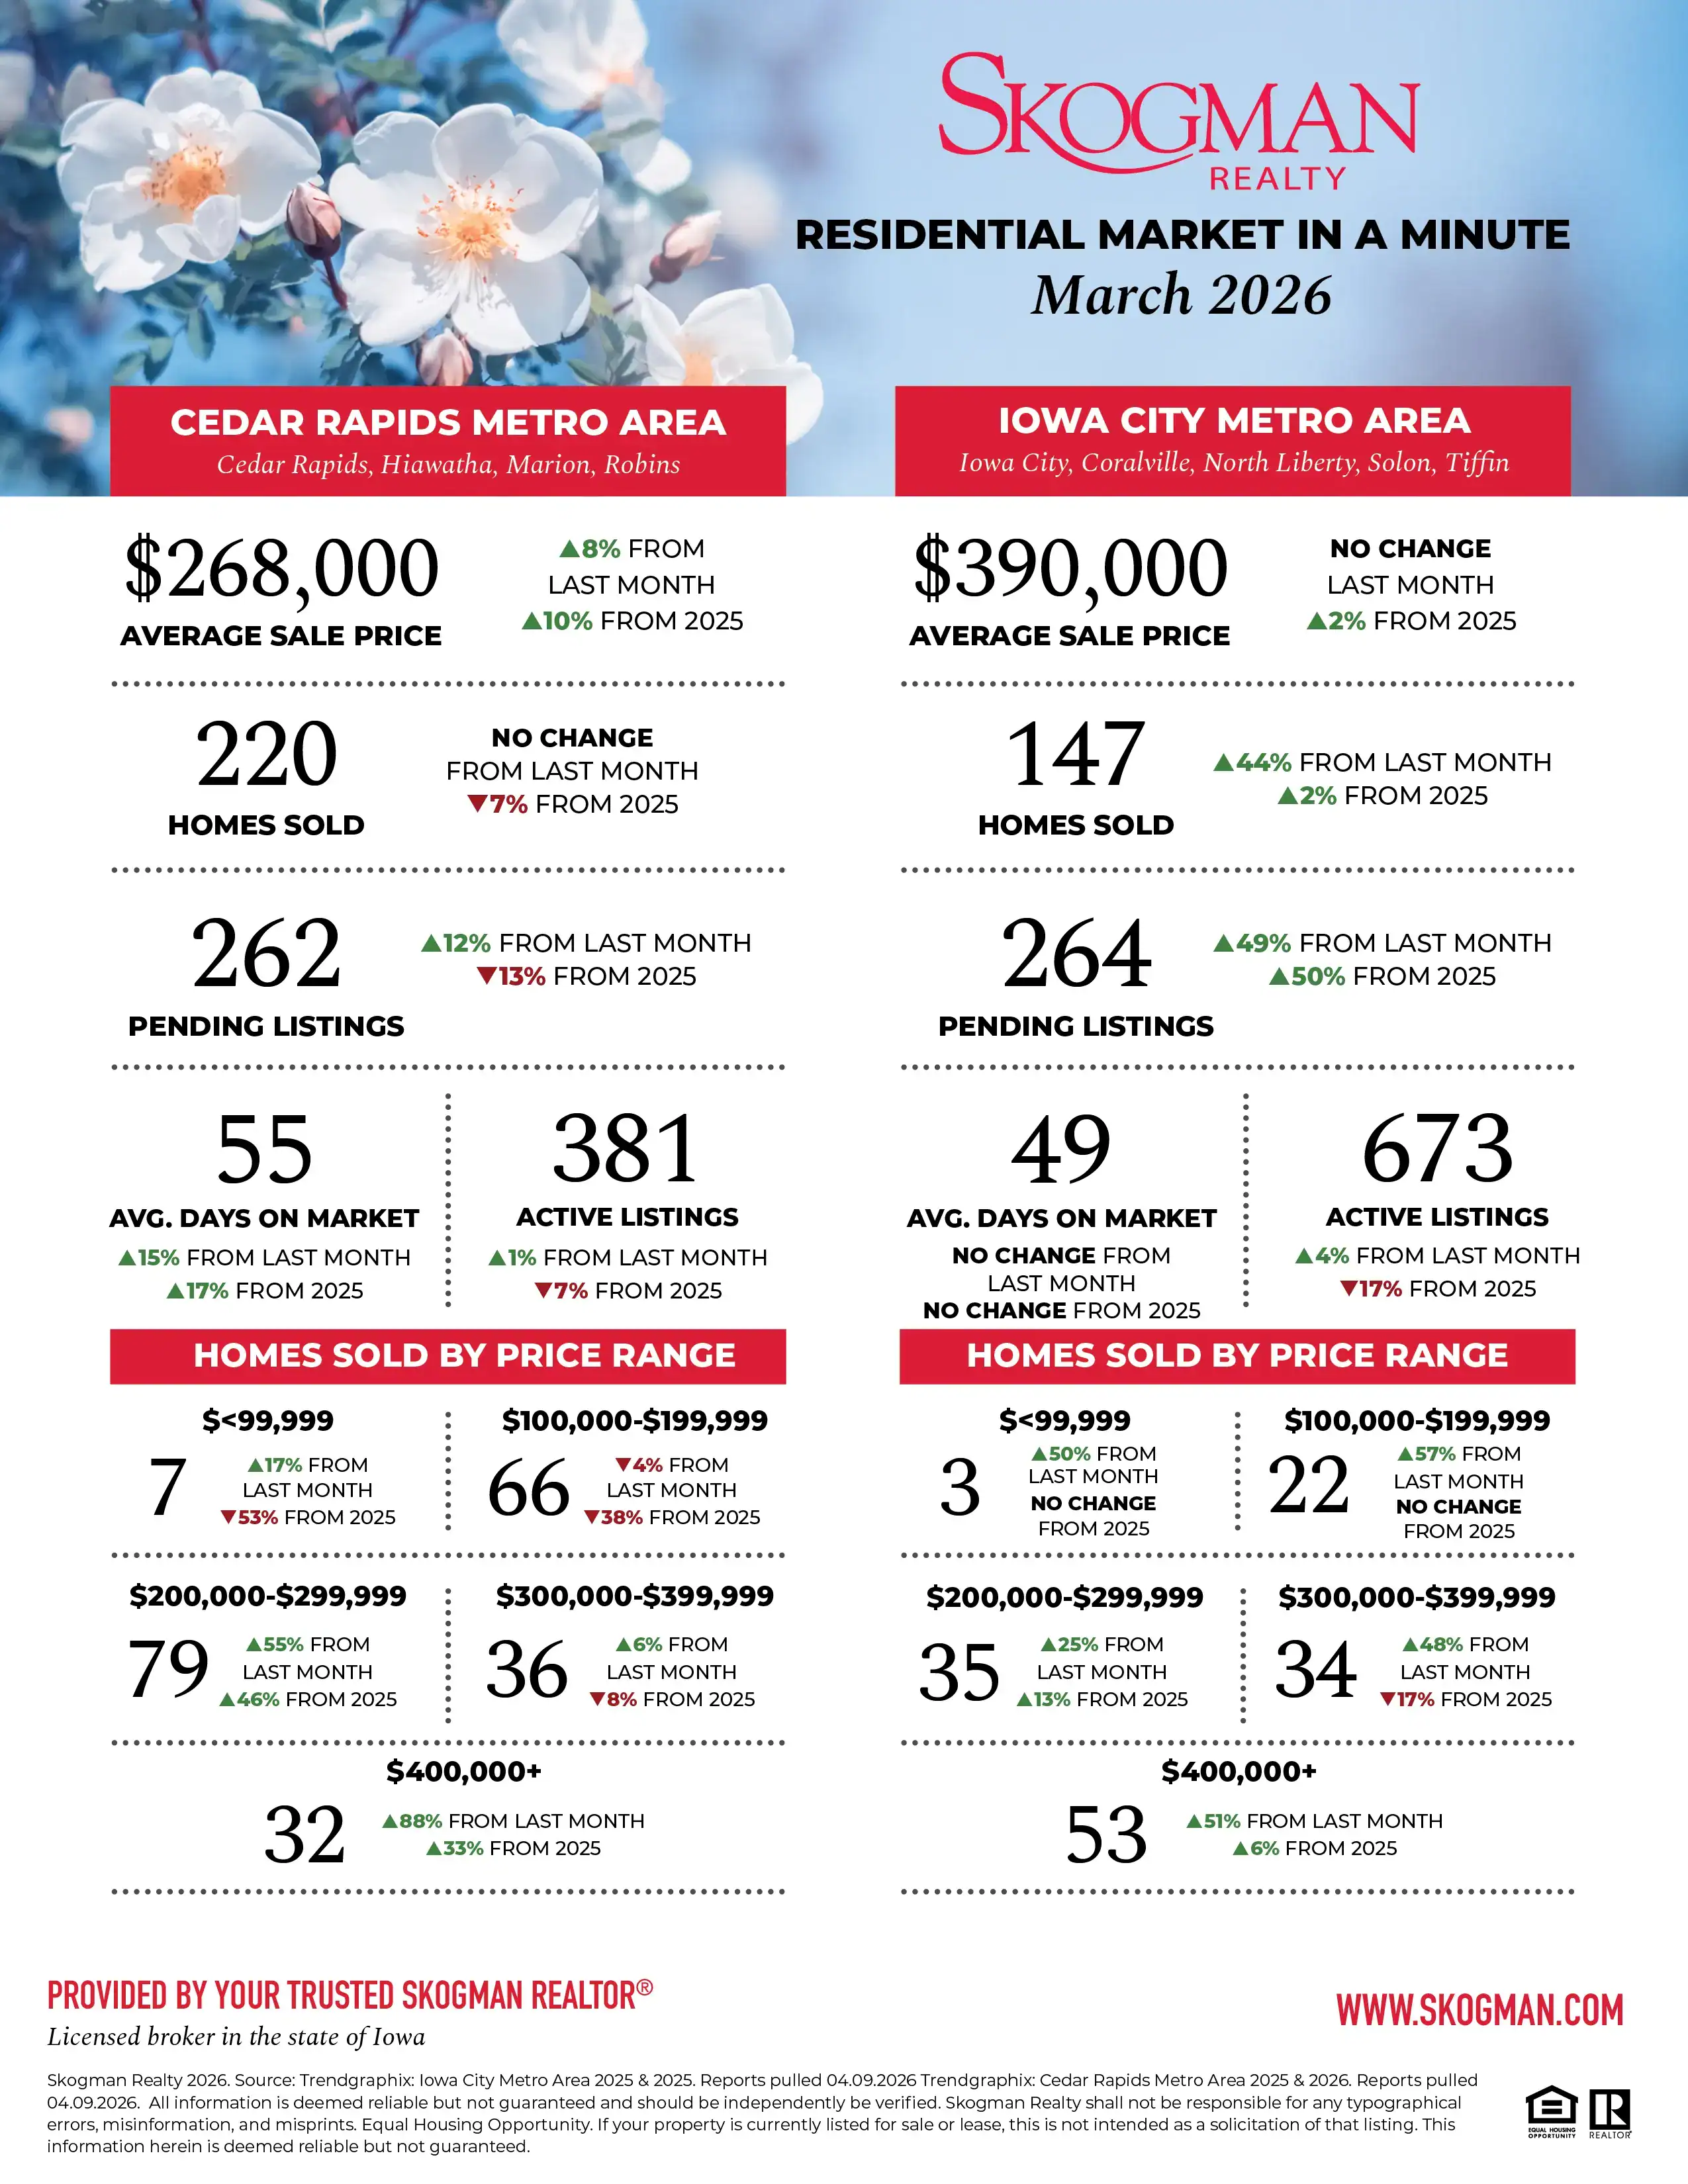
The Cedar Rapids metro continued its steady climb in March, with the average sale price reaching $268,000 — up 8% from February and 10% higher than this time last year. This consistent price growth reflects ongoing demand as we move deeper into the spring market.
A total of 220 homes sold during the month, holding steady compared to February but still 7% lower than March 2025. While year-over-year sales dipped slightly, buyer activity is picking up in a meaningful way — especially when looking at pending listings.
Pending activity rose to 262 homes under contract, a 12% increase from last month, signaling strong momentum heading into April. At the same time, active inventory remained tight at 381 listings, nearly unchanged month-over-month and down 7% compared to last year — continuing to create a competitive environment for buyers.
Homes spent an average of 55 days on market, up 15% from February and 17% longer than last year, suggesting a slight normalization in pace even as demand remains strong.
By price range, the $200,000–$299,999 segment led the way with 79 sales, while the $400,000+ range saw 32 sales, up 88% from last month and 33% year-over-year — a strong signal of movement at the higher end of the market.
Iowa City Metro Area
Iowa City, Coralville, North Liberty, Solon, Tiffin
The Iowa City metro saw a surge in activity in March, with several key indicators pointing to a fast-moving spring market. The average sale price climbed to $390,000, holding steady month-over-month and up 2% from last year.
Sales activity jumped significantly, with 147 homes sold — a 44% increase from February and a 2% gain compared to March 2025. This spike highlights renewed buyer urgency as more homes hit the market.
Pending listings told an even stronger story, rising to 264 homes under contract, up 49% from last month and 50% higher than a year ago — one of the clearest indicators of sustained demand.
Inventory ticked up slightly to 673 active listings, a 4% increase from February, though still down 17% year-over-year. Despite the slight increase in supply, homes are still moving efficiently, with an average of 49 days on market, unchanged from last month and last year.
Looking at price segments, the $400,000+ category led with 53 sales, up 51% from February and 6% year-over-year. The $300,000–$399,999 range also showed strength with 34 sales, reflecting continued demand across mid-to-upper price points.
March made one thing clear: the spring market is here, and activity is ramping up across Eastern Iowa. With more buyers entering the market and inventory still relatively tight, conditions remain competitive — especially for well-priced homes.
Whether you’re thinking about listing, starting your home search, or just keeping an eye on trends, now is the time to pay attention. For a personalized look at what these numbers mean for your next move, connect with your trusted Skogman Realtor®.